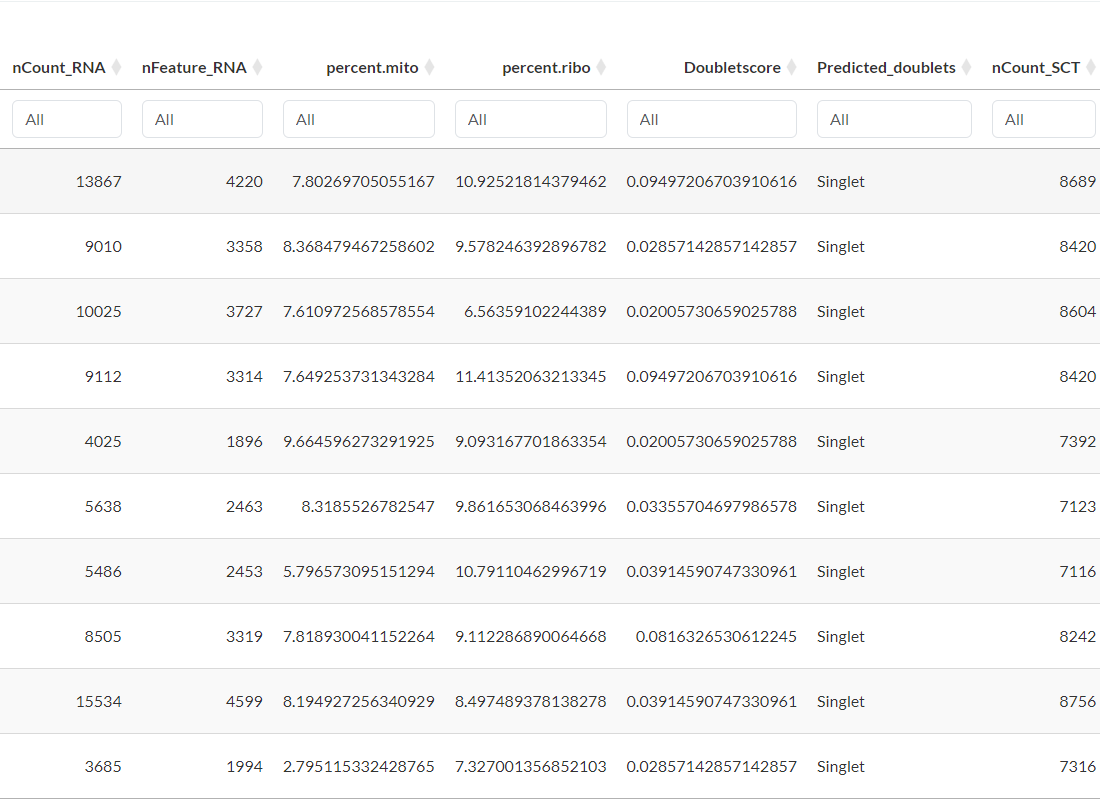
Metadata table
Access and review the metadata associated with the 17 datasets used in this study.
Visualize predicted ligand-receptor interactions between GABAergic and Glutamatergic cells during Somatosensory Cortex development.
A detailed overview of the features available in the scLRSomatoDev application.
Access and review the metadata associated with the 17 datasets used in this study.
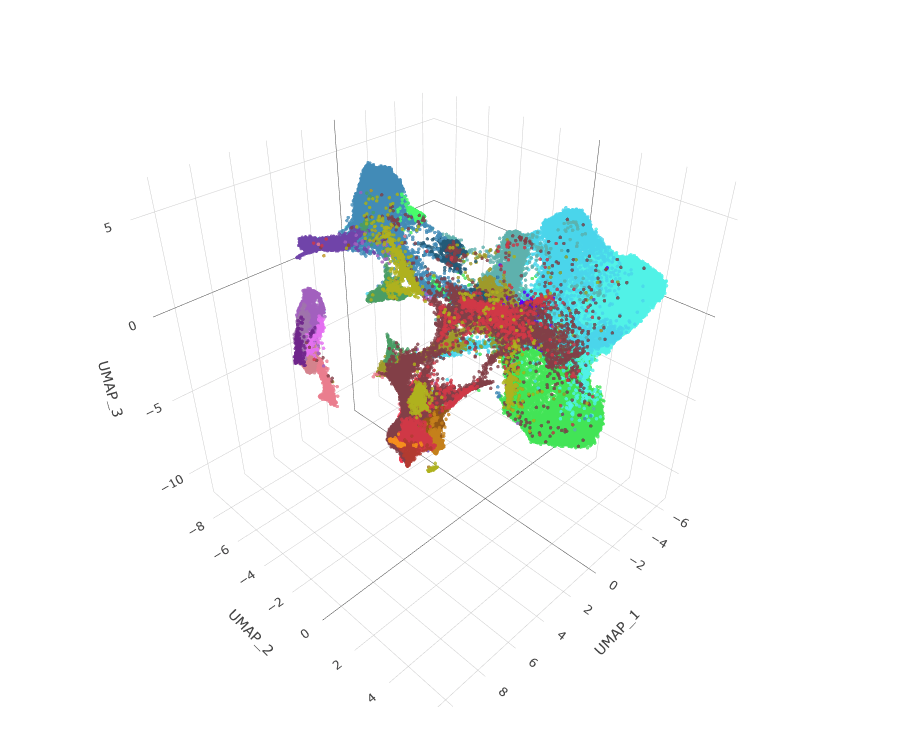
Visualize the distinct cell-type populations in the dataset using UMAP (or alternative dimensionality reduction methods) and explore the expression profiles of one or two genes.
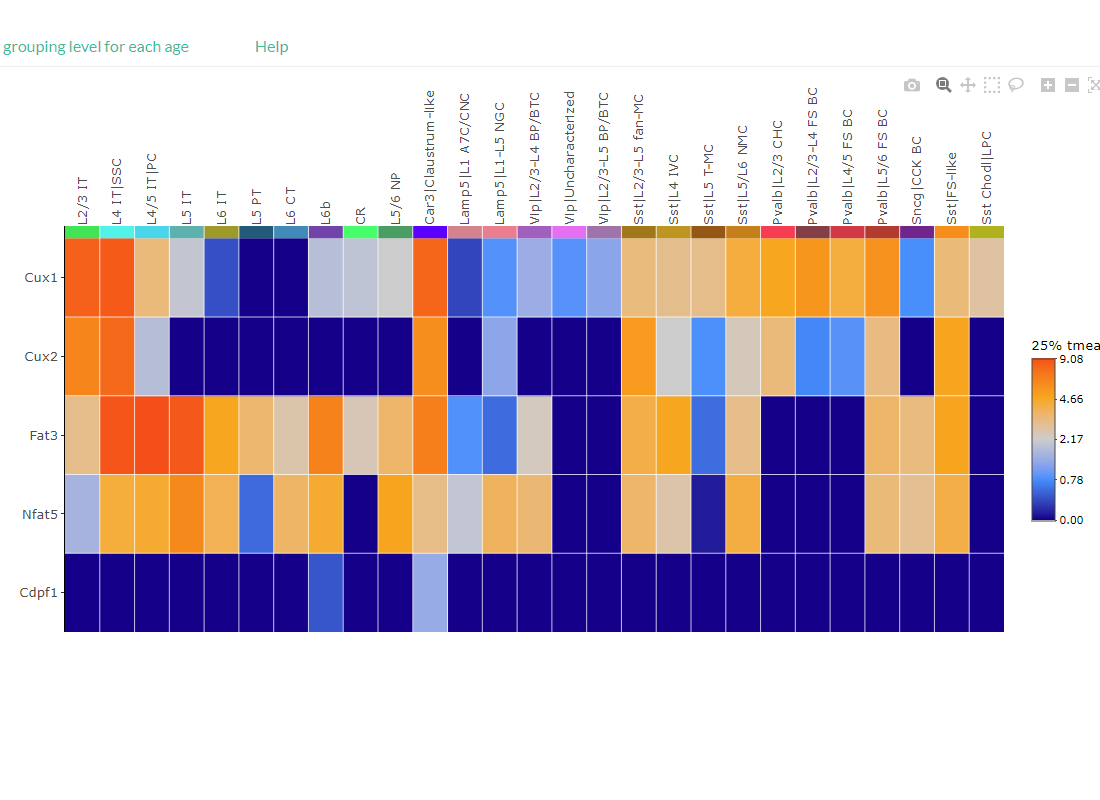
Visualize the expression profiles of multiple genes per cell-type across cortical development using a heatmap or Dot plot.
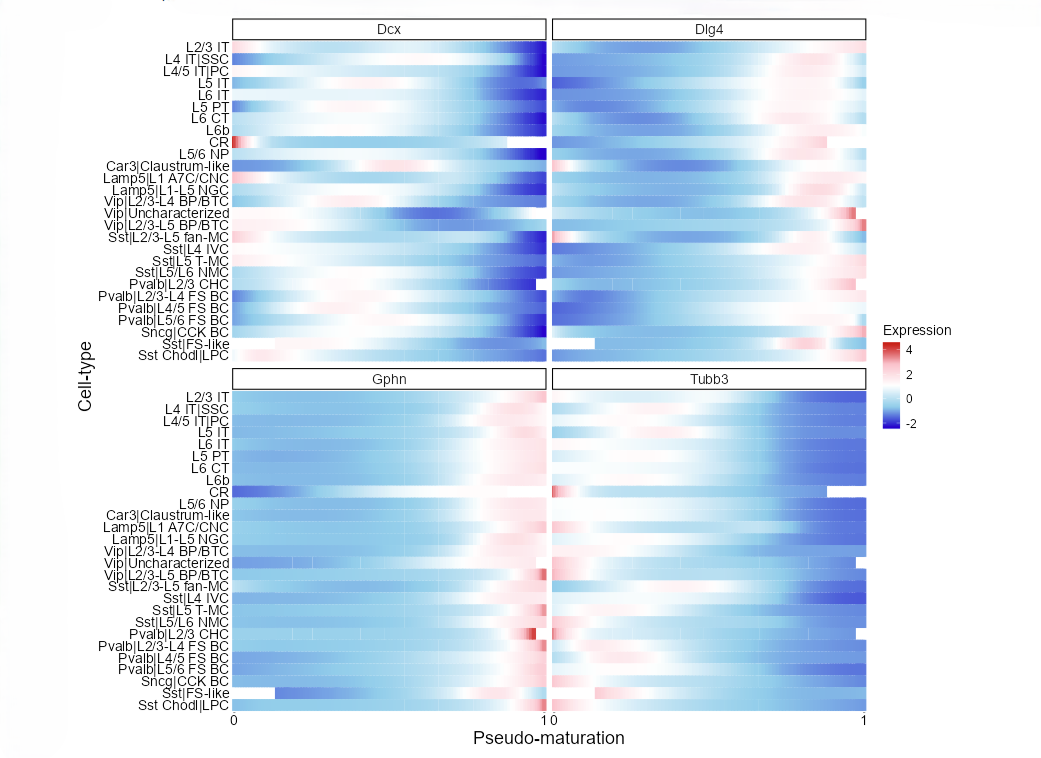
Visualize the dynamics of gene expression along the pseudo-maturation axis.
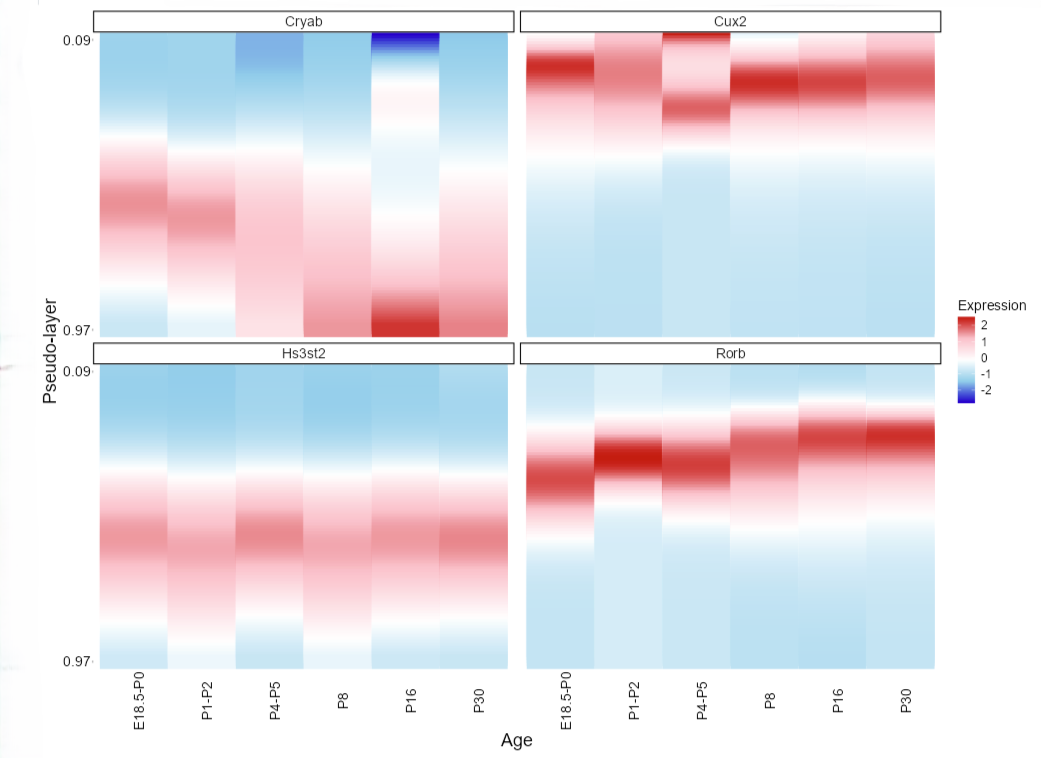
Visualize the dynamics of gene expression along the pseudo-layer axis.
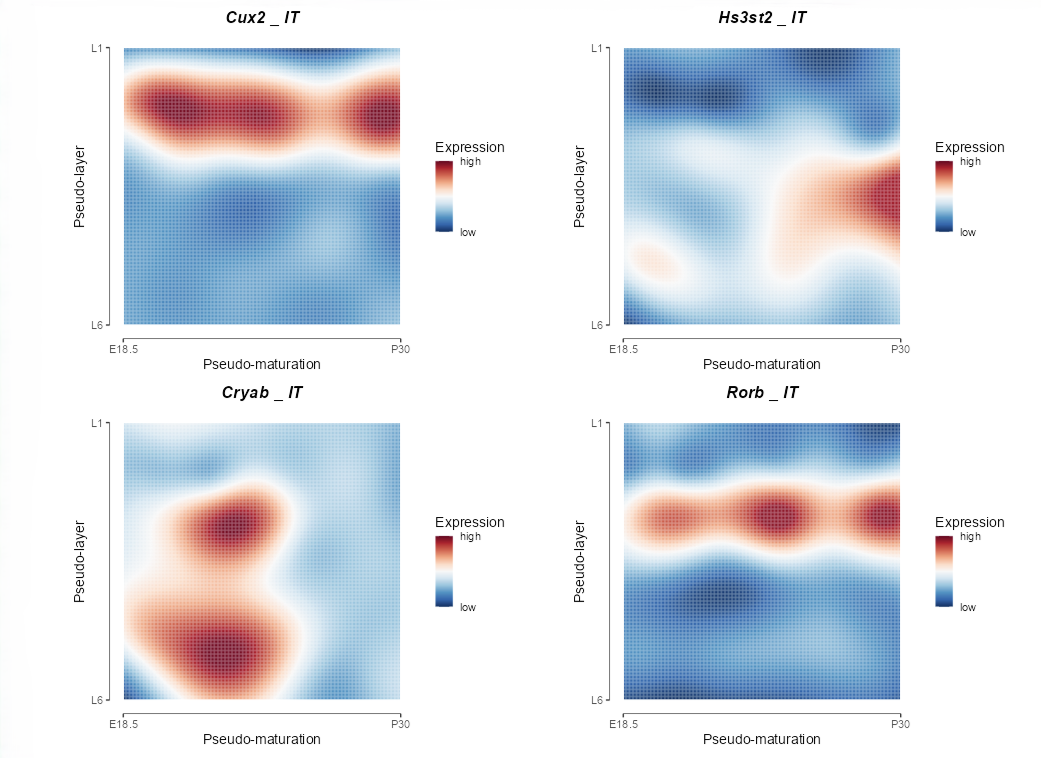
Visualize the dynamics of gene expression along both the pseudo-maturation and pseudo-layer axes, represented as a 2D map.
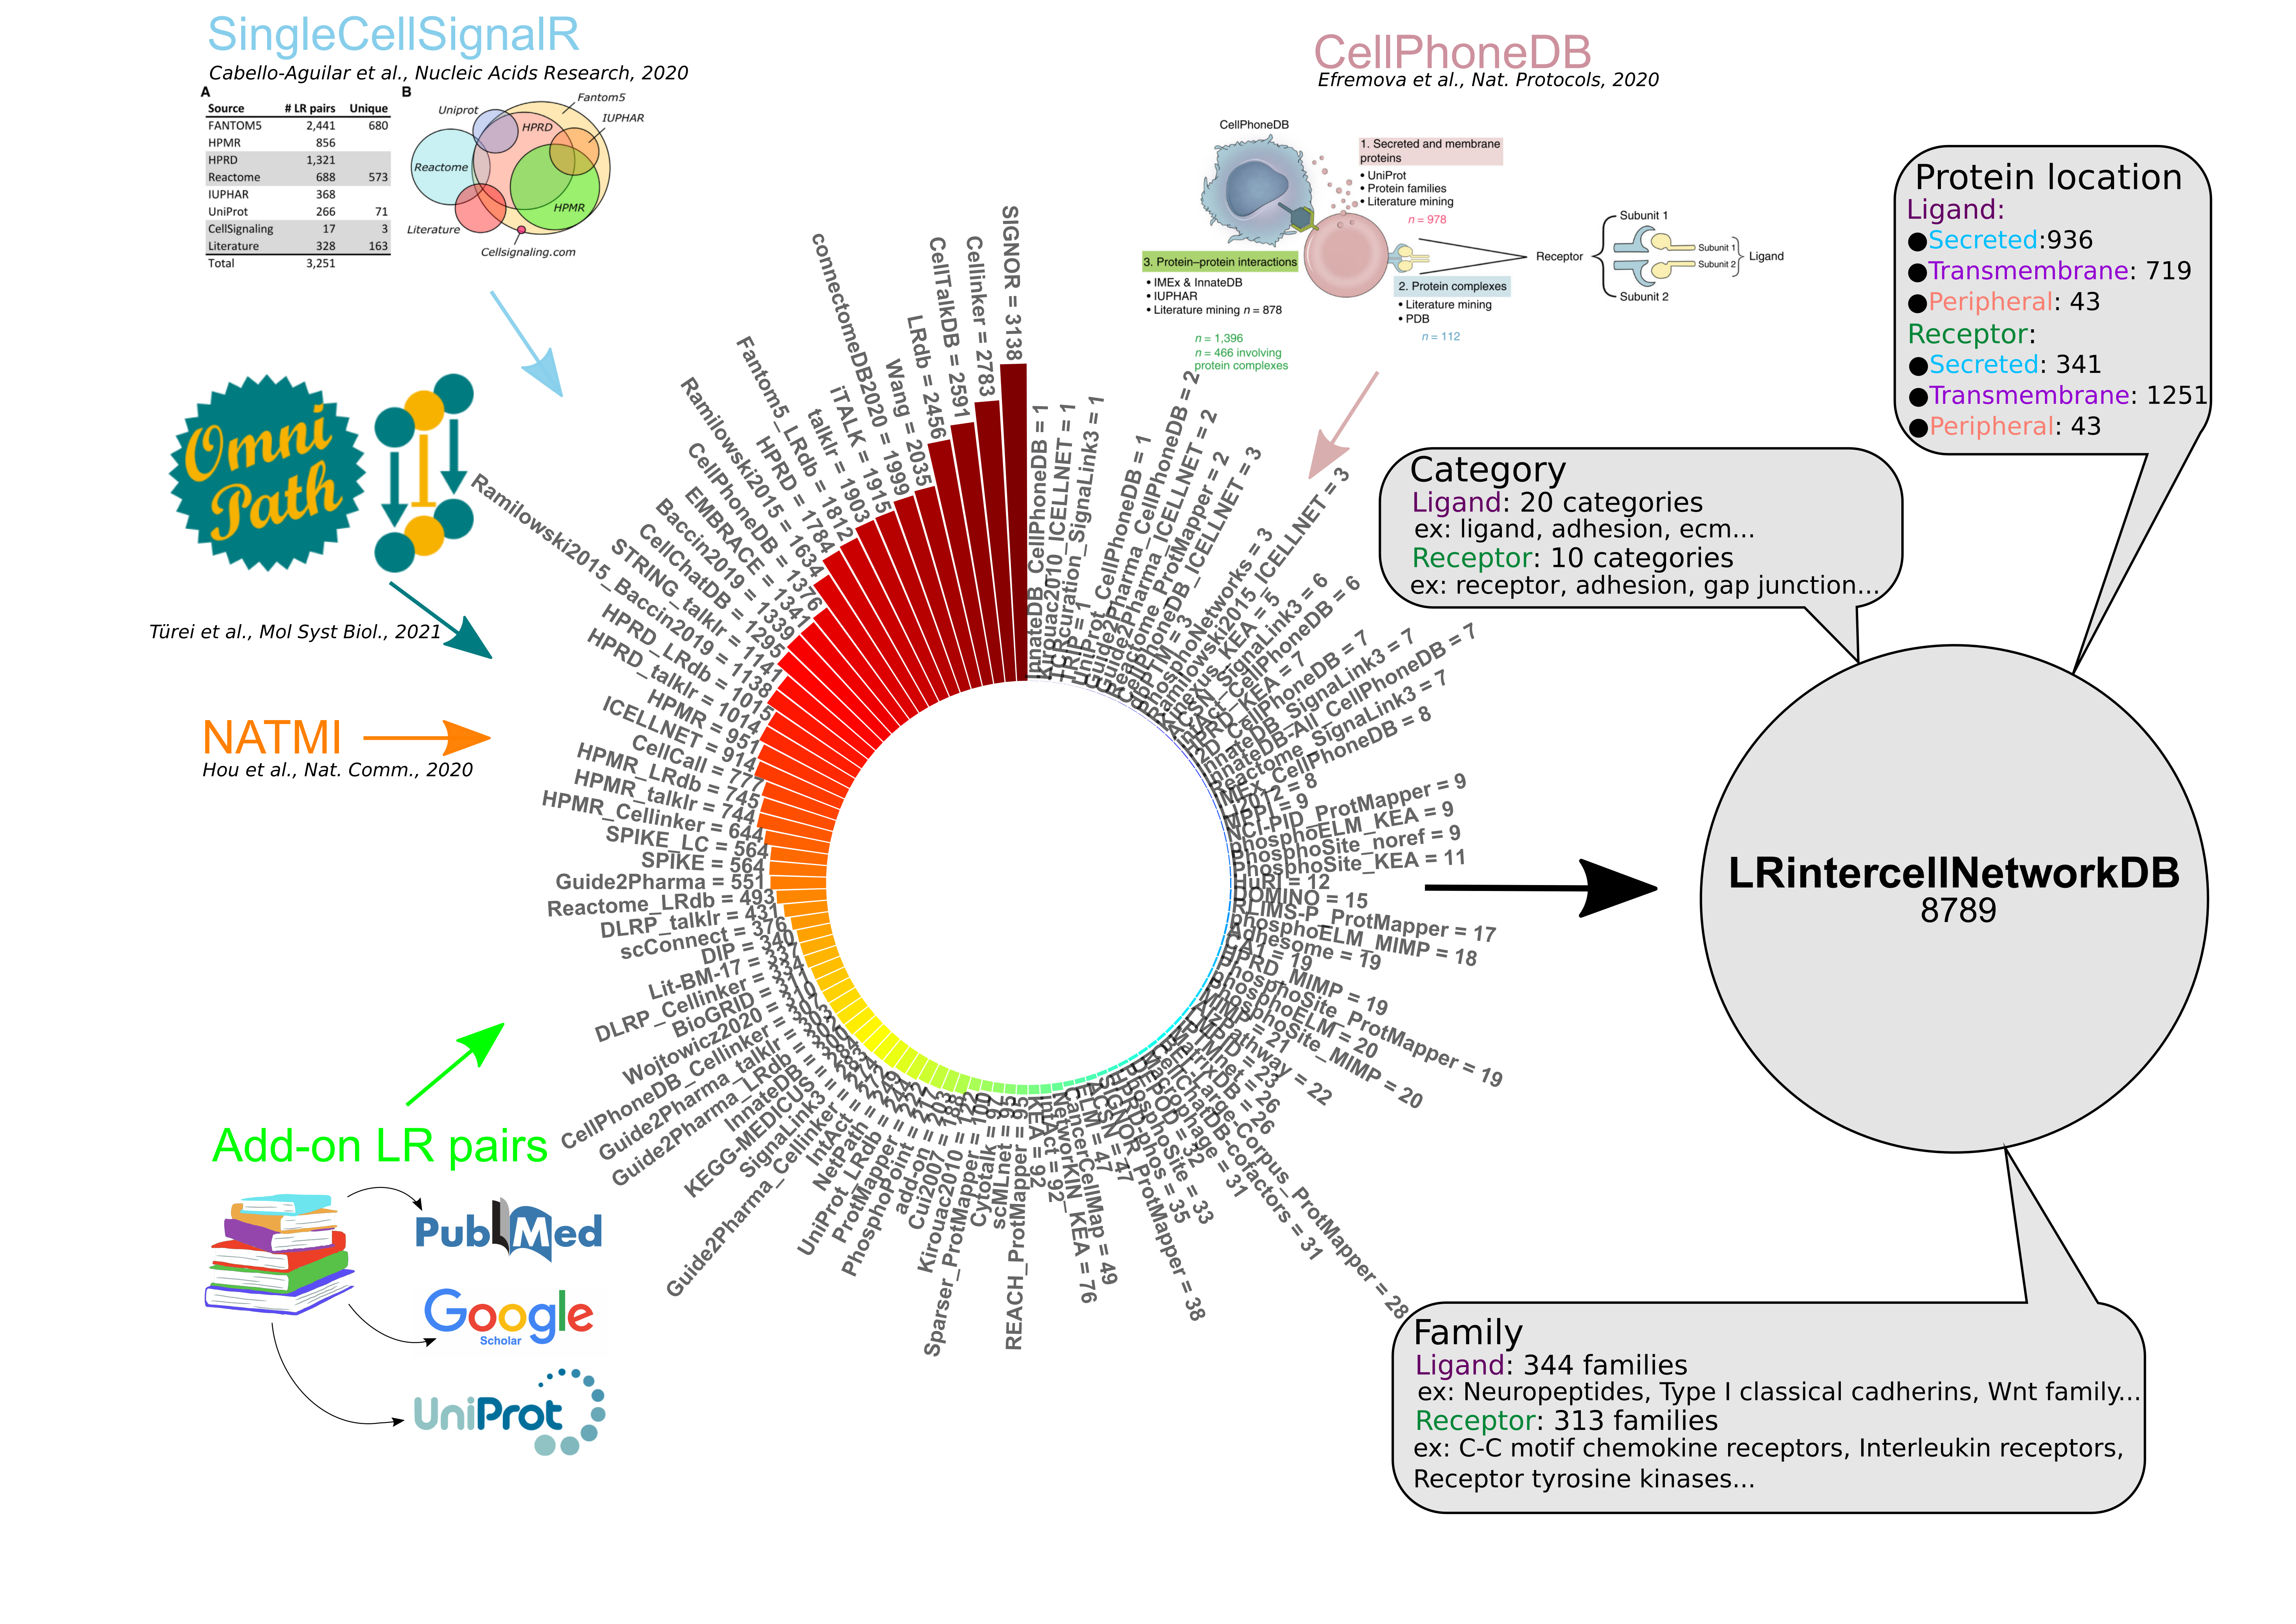
Explore the curated database of ligand-receptor pairs.
Access the tables resulting from intercellular and intracellular signaling analyses performed with scSeqComm (Baruzzo et al., 2022) for each developmental age, .ie., E18.5-P0, P1-P2, P4-P5, P8, P16, P30, and Adult.
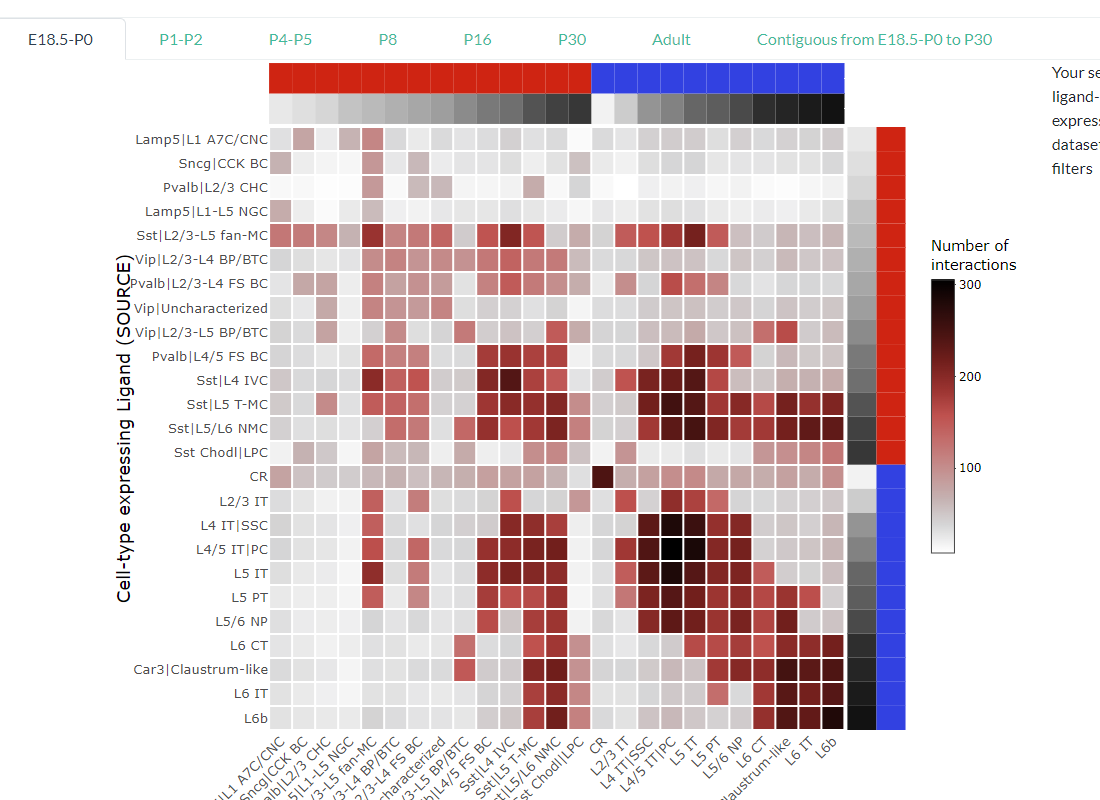
Visualize the number of predicted interactions (ligand-receptor pairs) between each cell-type pair for each developmental age, .i.e. , E18.5-P0, P1-P2, P4-P5, P8, P16, P30, and Adult.
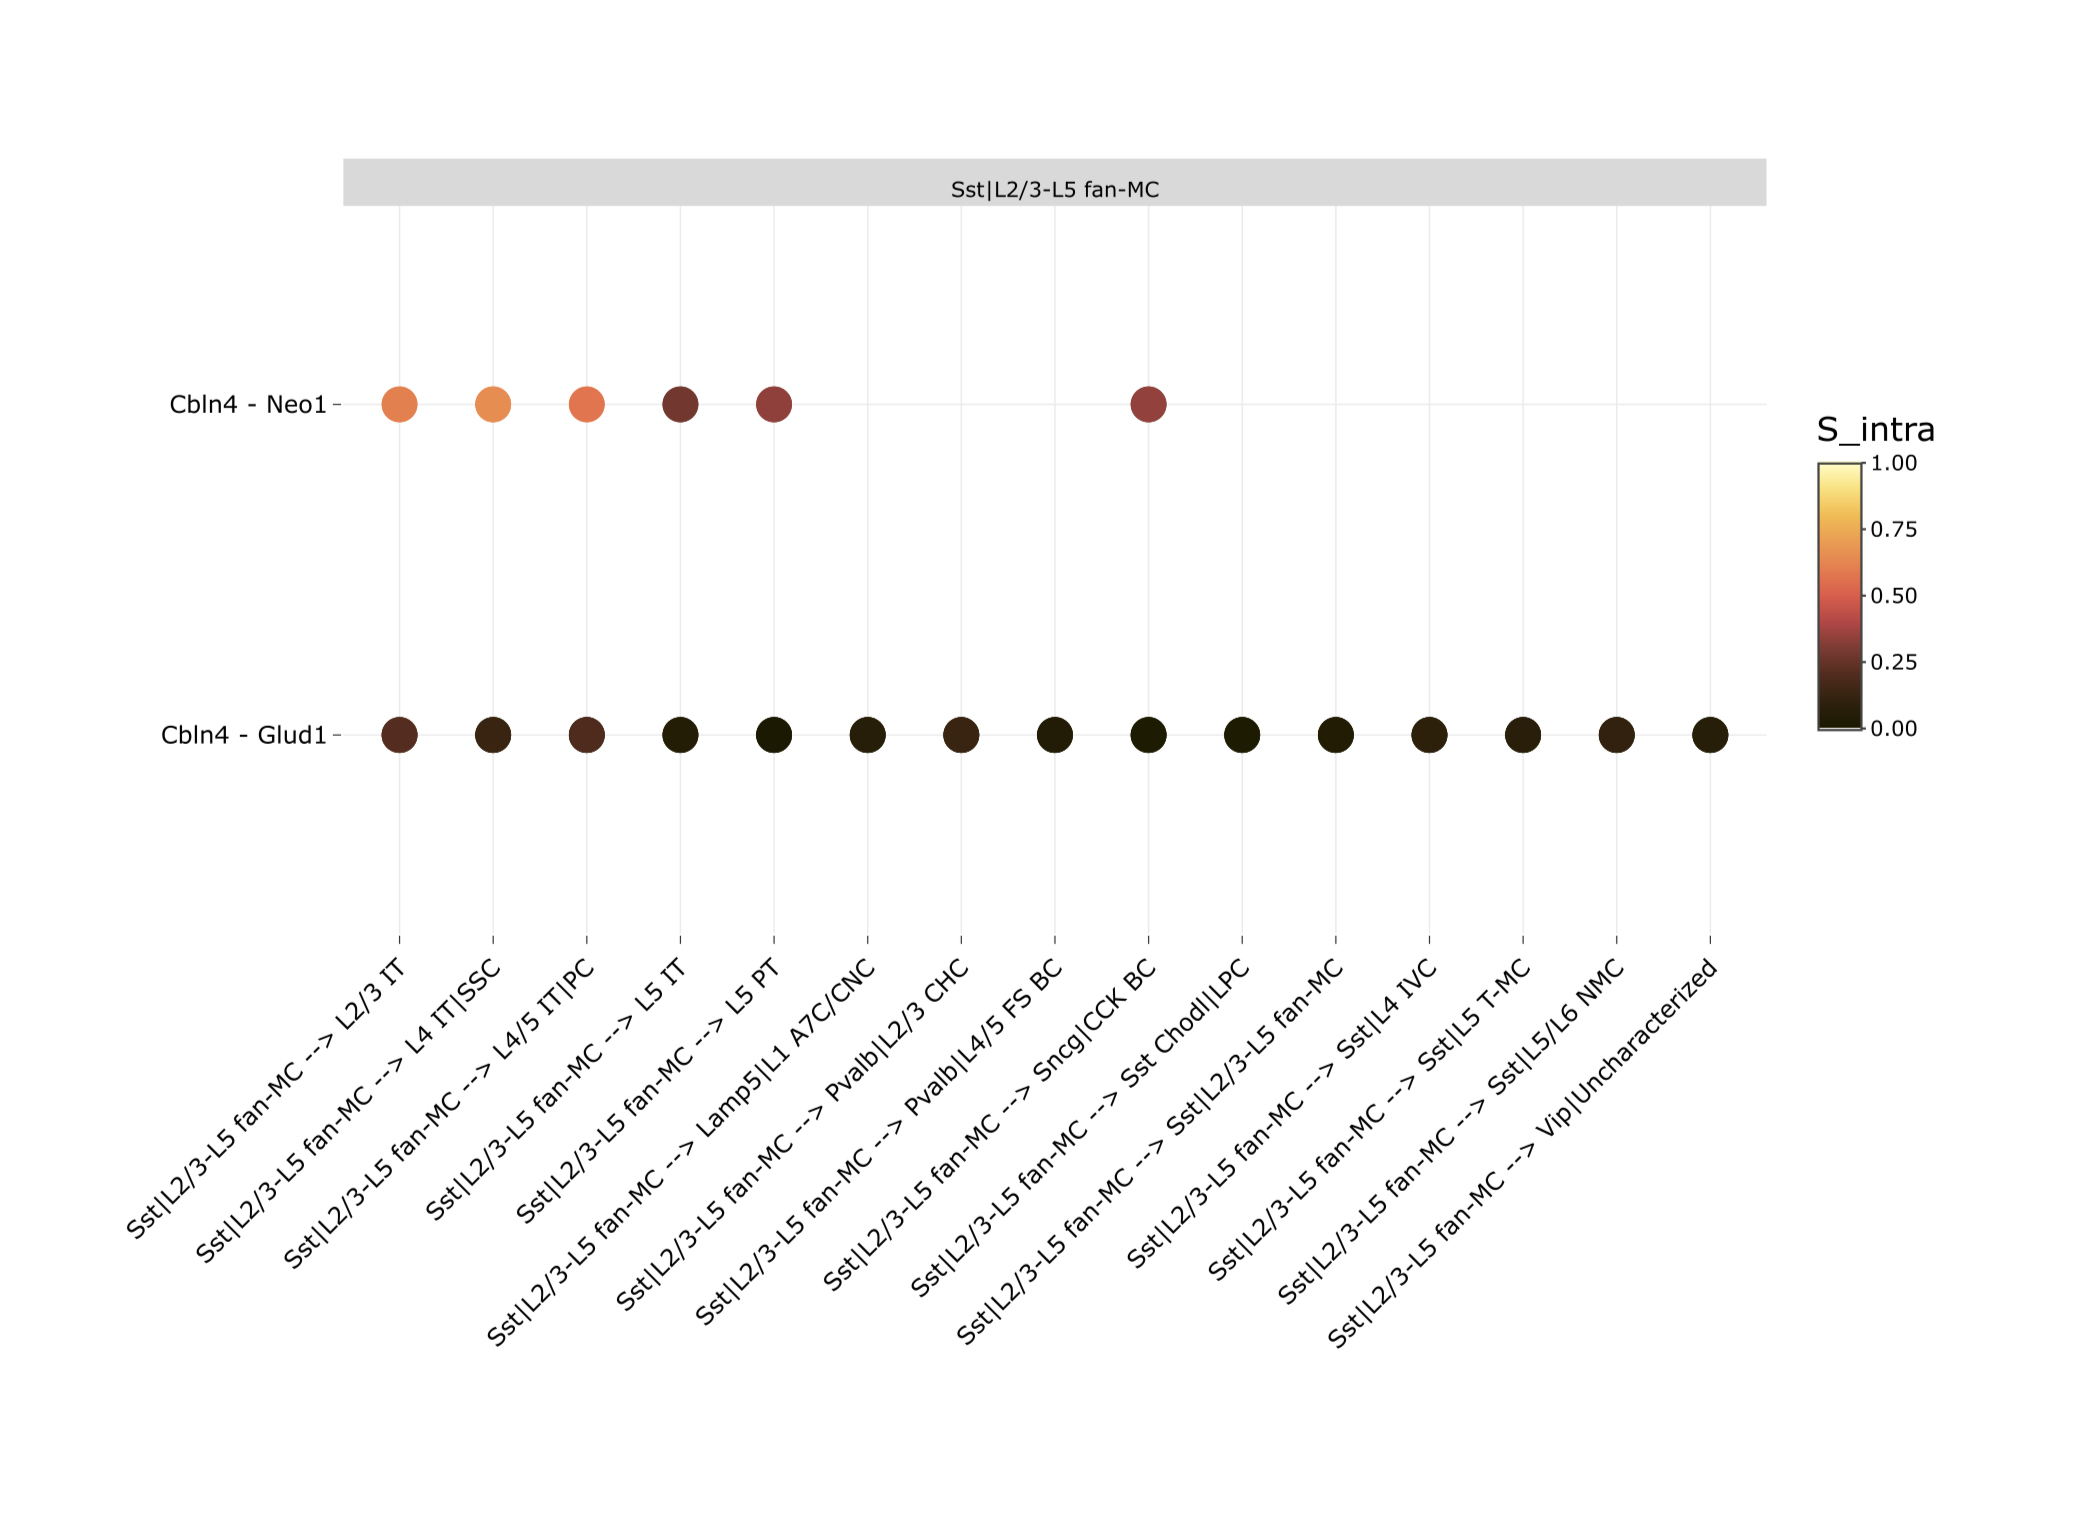
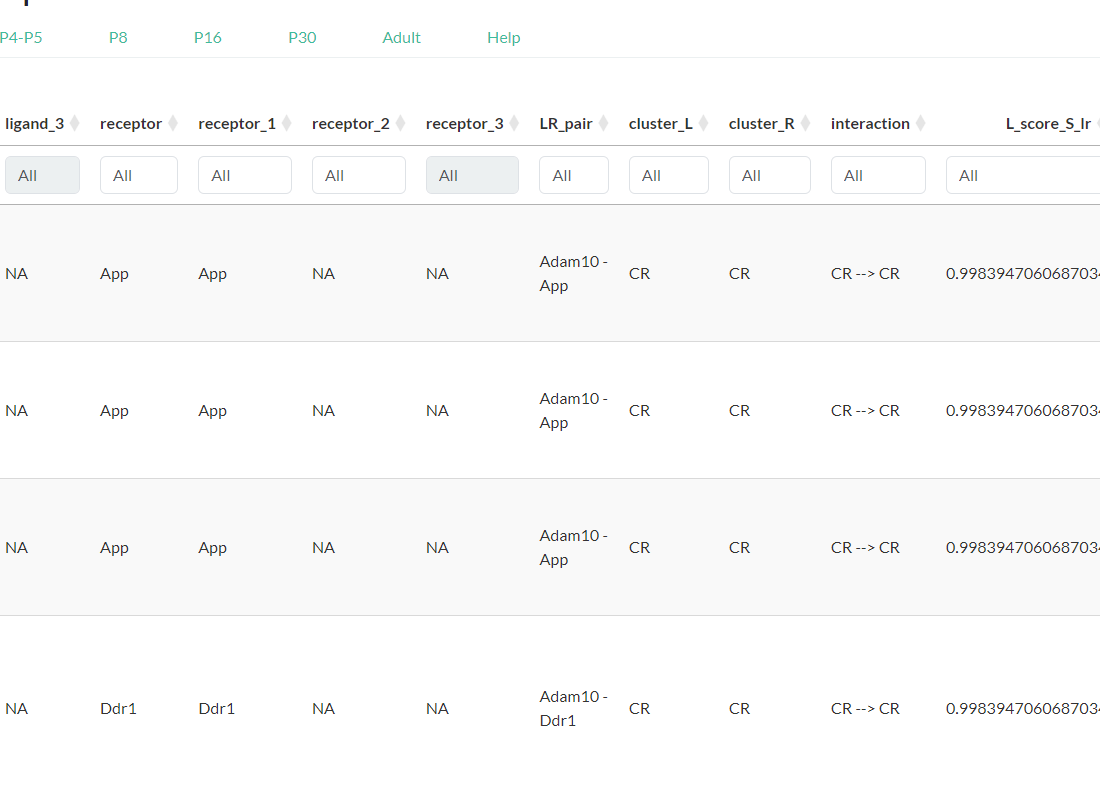
Visualize which ligand-receptor pairs are likely to be present between cell-type pairs and the pathways in which they are involved.
Experience our interactive data exploration tool online
Installation instructions and documentation are available on the scLRSomatoDev Documentation and our GitHub repository.
No installation required • Works in your browser
Get in touch with our research team or reach out for technical support with the application.